{var%20f='http://v.t.sina.com.cn/share/share.php?appkey=1515056452',u=z||d.location,p=['&url=',e(u),'&title=',e(t||d.title),'&source=',e(r),'&sourceUrl=',e(l),'&content=',c||'gb2312','&pic=',e(p||'')].join('');function%20a(){if(!window.open([f,p].join(''),'mb',['toolbar=0,status=0,resizable=1,width=440,height=430,left=',(s.width-440)/2,',top=',(s.height-430)/2].join('')))u.href=[f,p].join('');};if(/Firefox/.test(navigator.userAgent))setTimeout(a,0);else%20a();})(screen,document,encodeURIComponent,'','','https://www.manongdao.com/data/attach/logo/logo.png', '推荐 贼婆χ 的问题《Highcharts Progress Bar Chart》','https://www.manongdao.com/q-863721.html','页面编码gb2312|utf-8默认gb2312'));)
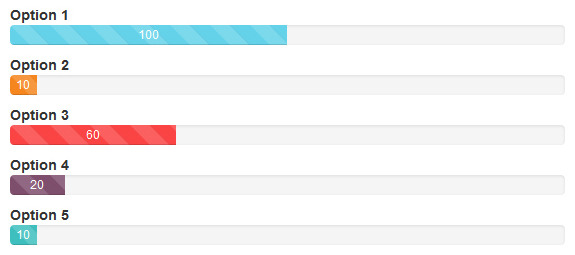
Is it possible to create a progress chart in Highcharts like this:
https://0.s3.envato.com/files/84221450/screenshots/weblator_responsive_charts_7_bootstrap.jpg
I believe a bar chart can be customized to create this. But is it possible to change the styling so that no axes are showing and the bar labels are positioned above the bars rather than preceding them?
Possible to recreate but it is not so dynamic( in style ). So you have to adjust
cssaccording to data series in chart.