{var%20f='http://v.t.sina.com.cn/share/share.php?appkey=1515056452',u=z||d.location,p=['&url=',e(u),'&title=',e(t||d.title),'&source=',e(r),'&sourceUrl=',e(l),'&content=',c||'gb2312','&pic=',e(p||'')].join('');function%20a(){if(!window.open([f,p].join(''),'mb',['toolbar=0,status=0,resizable=1,width=440,height=430,left=',(s.width-440)/2,',top=',(s.height-430)/2].join('')))u.href=[f,p].join('');};if(/Firefox/.test(navigator.userAgent))setTimeout(a,0);else%20a();})(screen,document,encodeURIComponent,'','','https://www.manongdao.com/data/attach/logo/logo.png', '推荐 淡お忘 的问题《Getting VertexRenderingFunction to (not) scale》','https://www.manongdao.com/q-855247.html','页面编码gb2312|utf-8默认gb2312'));)
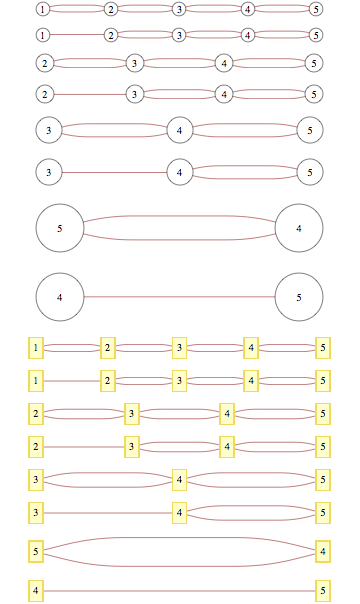
I'm having problem with custom VertexRenderingFunction showing at different sizes for different graphs. An example is below, the default vertex rendering function has the desired behavior since vertices look the same in all graphs, any suggestion how to achieve that with custom vertices?
http://yaroslavvb.com/upload/vrf-scaling.png
edges = Most[
    ArrayRules[GraphData[{"Path", 5}, "AdjacencyMatrix"]]][[All, 1]];
doit[vrf_] :=
  Print /@ Table[
    GraphPlot[Rule @@@ edges[[k ;;]], VertexRenderingFunction -> vrf,
     VertexLabeling -> True], {k, 1, Length[edges]}];
doit[({White, EdgeForm[Black], Disk[#, .1], Black, Text[#2, #1]} &)];
doit[Automatic];
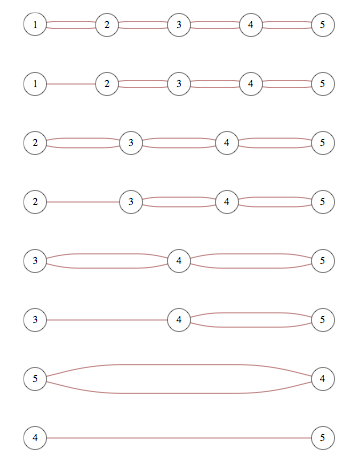
Update, 1 hour later:
Michael Pilat as usual gives the solution, here's what it looks like with
(Inset[Graphics[{White, EdgeForm[Black], Disk[{0, 0}, .05], Black,
     Text[#2, {0, 0}]}, ImageSize -> 25], #] &)
for rendering function
InsetaGraphicsexpression with theImageSizeoption to place your vertices:ImageSizecan take a variety of values from printer's points to aScaledvalue.Insetcan also/instead take a size in its fourth argument, but the default setting defers to theImageSizeof the insetGraphicsobject, which is a little cleaner to use in this case.Hope that helps!