{var%20f='http://v.t.sina.com.cn/share/share.php?appkey=1515056452',u=z||d.location,p=['&url=',e(u),'&title=',e(t||d.title),'&source=',e(r),'&sourceUrl=',e(l),'&content=',c||'gb2312','&pic=',e(p||'')].join('');function%20a(){if(!window.open([f,p].join(''),'mb',['toolbar=0,status=0,resizable=1,width=440,height=430,left=',(s.width-440)/2,',top=',(s.height-430)/2].join('')))u.href=[f,p].join('');};if(/Firefox/.test(navigator.userAgent))setTimeout(a,0);else%20a();})(screen,document,encodeURIComponent,'','','https://www.manongdao.com/data/attach/logo/logo.png', '推荐 成全新的幸福 的问题《ASP.NET Charting Control Transparency》','https://www.manongdao.com/q-772141.html','页面编码gb2312|utf-8默认gb2312'));)
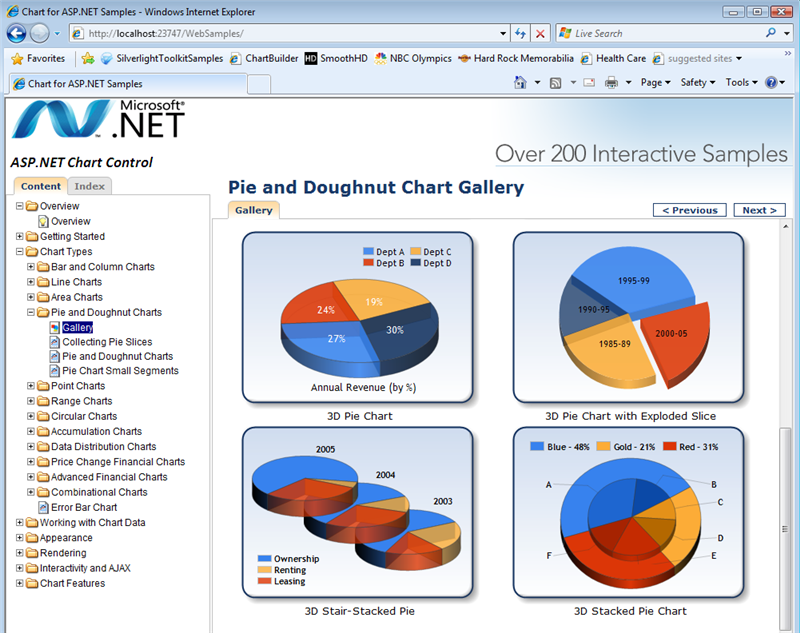
I'm working with the ASP.NET Charting Library and I've got it generating a pie chart but I'm having a problem configuring it to generate the pie chart with semi-transparent slices. If you look at the image you'll see what I'm talking about. Of the 4 pie charts the top 2 and the bottom left chart have the pie slice transparency I'm talking about.
Charting Control Image http://www.scottgu.com/blogposts/chart/step2.png
What settings of the chart do I tweak to render the slices with a certain % of transparency?
Thanks!
This the ultimate solution for both cases - one color per series or palette charts:
Try this:
Where 180 defines the "transparency level", which must be between 0 to 255.
You can use semi transparent palettes.
Refer to:
https://blogs.msdn.microsoft.com/alexgor/2009/10/06/setting-microsoft-chart-series-colors/
Try assigning the color of the series to a color with alpha transparency, like so:
Taken from this thread.