{var%20f='http://v.t.sina.com.cn/share/share.php?appkey=1515056452',u=z||d.location,p=['&url=',e(u),'&title=',e(t||d.title),'&source=',e(r),'&sourceUrl=',e(l),'&content=',c||'gb2312','&pic=',e(p||'')].join('');function%20a(){if(!window.open([f,p].join(''),'mb',['toolbar=0,status=0,resizable=1,width=440,height=430,left=',(s.width-440)/2,',top=',(s.height-430)/2].join('')))u.href=[f,p].join('');};if(/Firefox/.test(navigator.userAgent))setTimeout(a,0);else%20a();})(screen,document,encodeURIComponent,'','','https://www.manongdao.com/data/attach/logo/logo.png', '推荐 家丑人穷心不美 的问题《Is it possible to include maplines in highcharter》','https://www.manongdao.com/q-697677.html','页面编码gb2312|utf-8默认gb2312'));)
I'd like to use one set of borderColor and width values for counties and another set for state lines in highcharter as done in this jsfiddle link.
series: [{
            mapData: countiesMap,
            data: data,
            joinBy: ['hc-key', 'code'],
            name: 'Unemployment rate',
            tooltip: {
                valueSuffix: '%'
            },
            borderWidth: 0.5,
            states: {
                hover: {
                    color: '#bada55'
                }
            }
        }, {
            type: 'mapline',
            name: 'State borders',
            data: [lines[0]],
            color: 'white'
        }, {
            type: 'mapline',
            name: 'Separator',
            data: [lines[1]],
            color: 'gray'
        }]
However, I don't understand the data structure and I don't see how the highcharter api allows this to be done. Is this kind of map possible? My first instinct was to add a polygon layer without fill for state borders but this doesn't seem to be the approach to use in highmaps/highcharts.
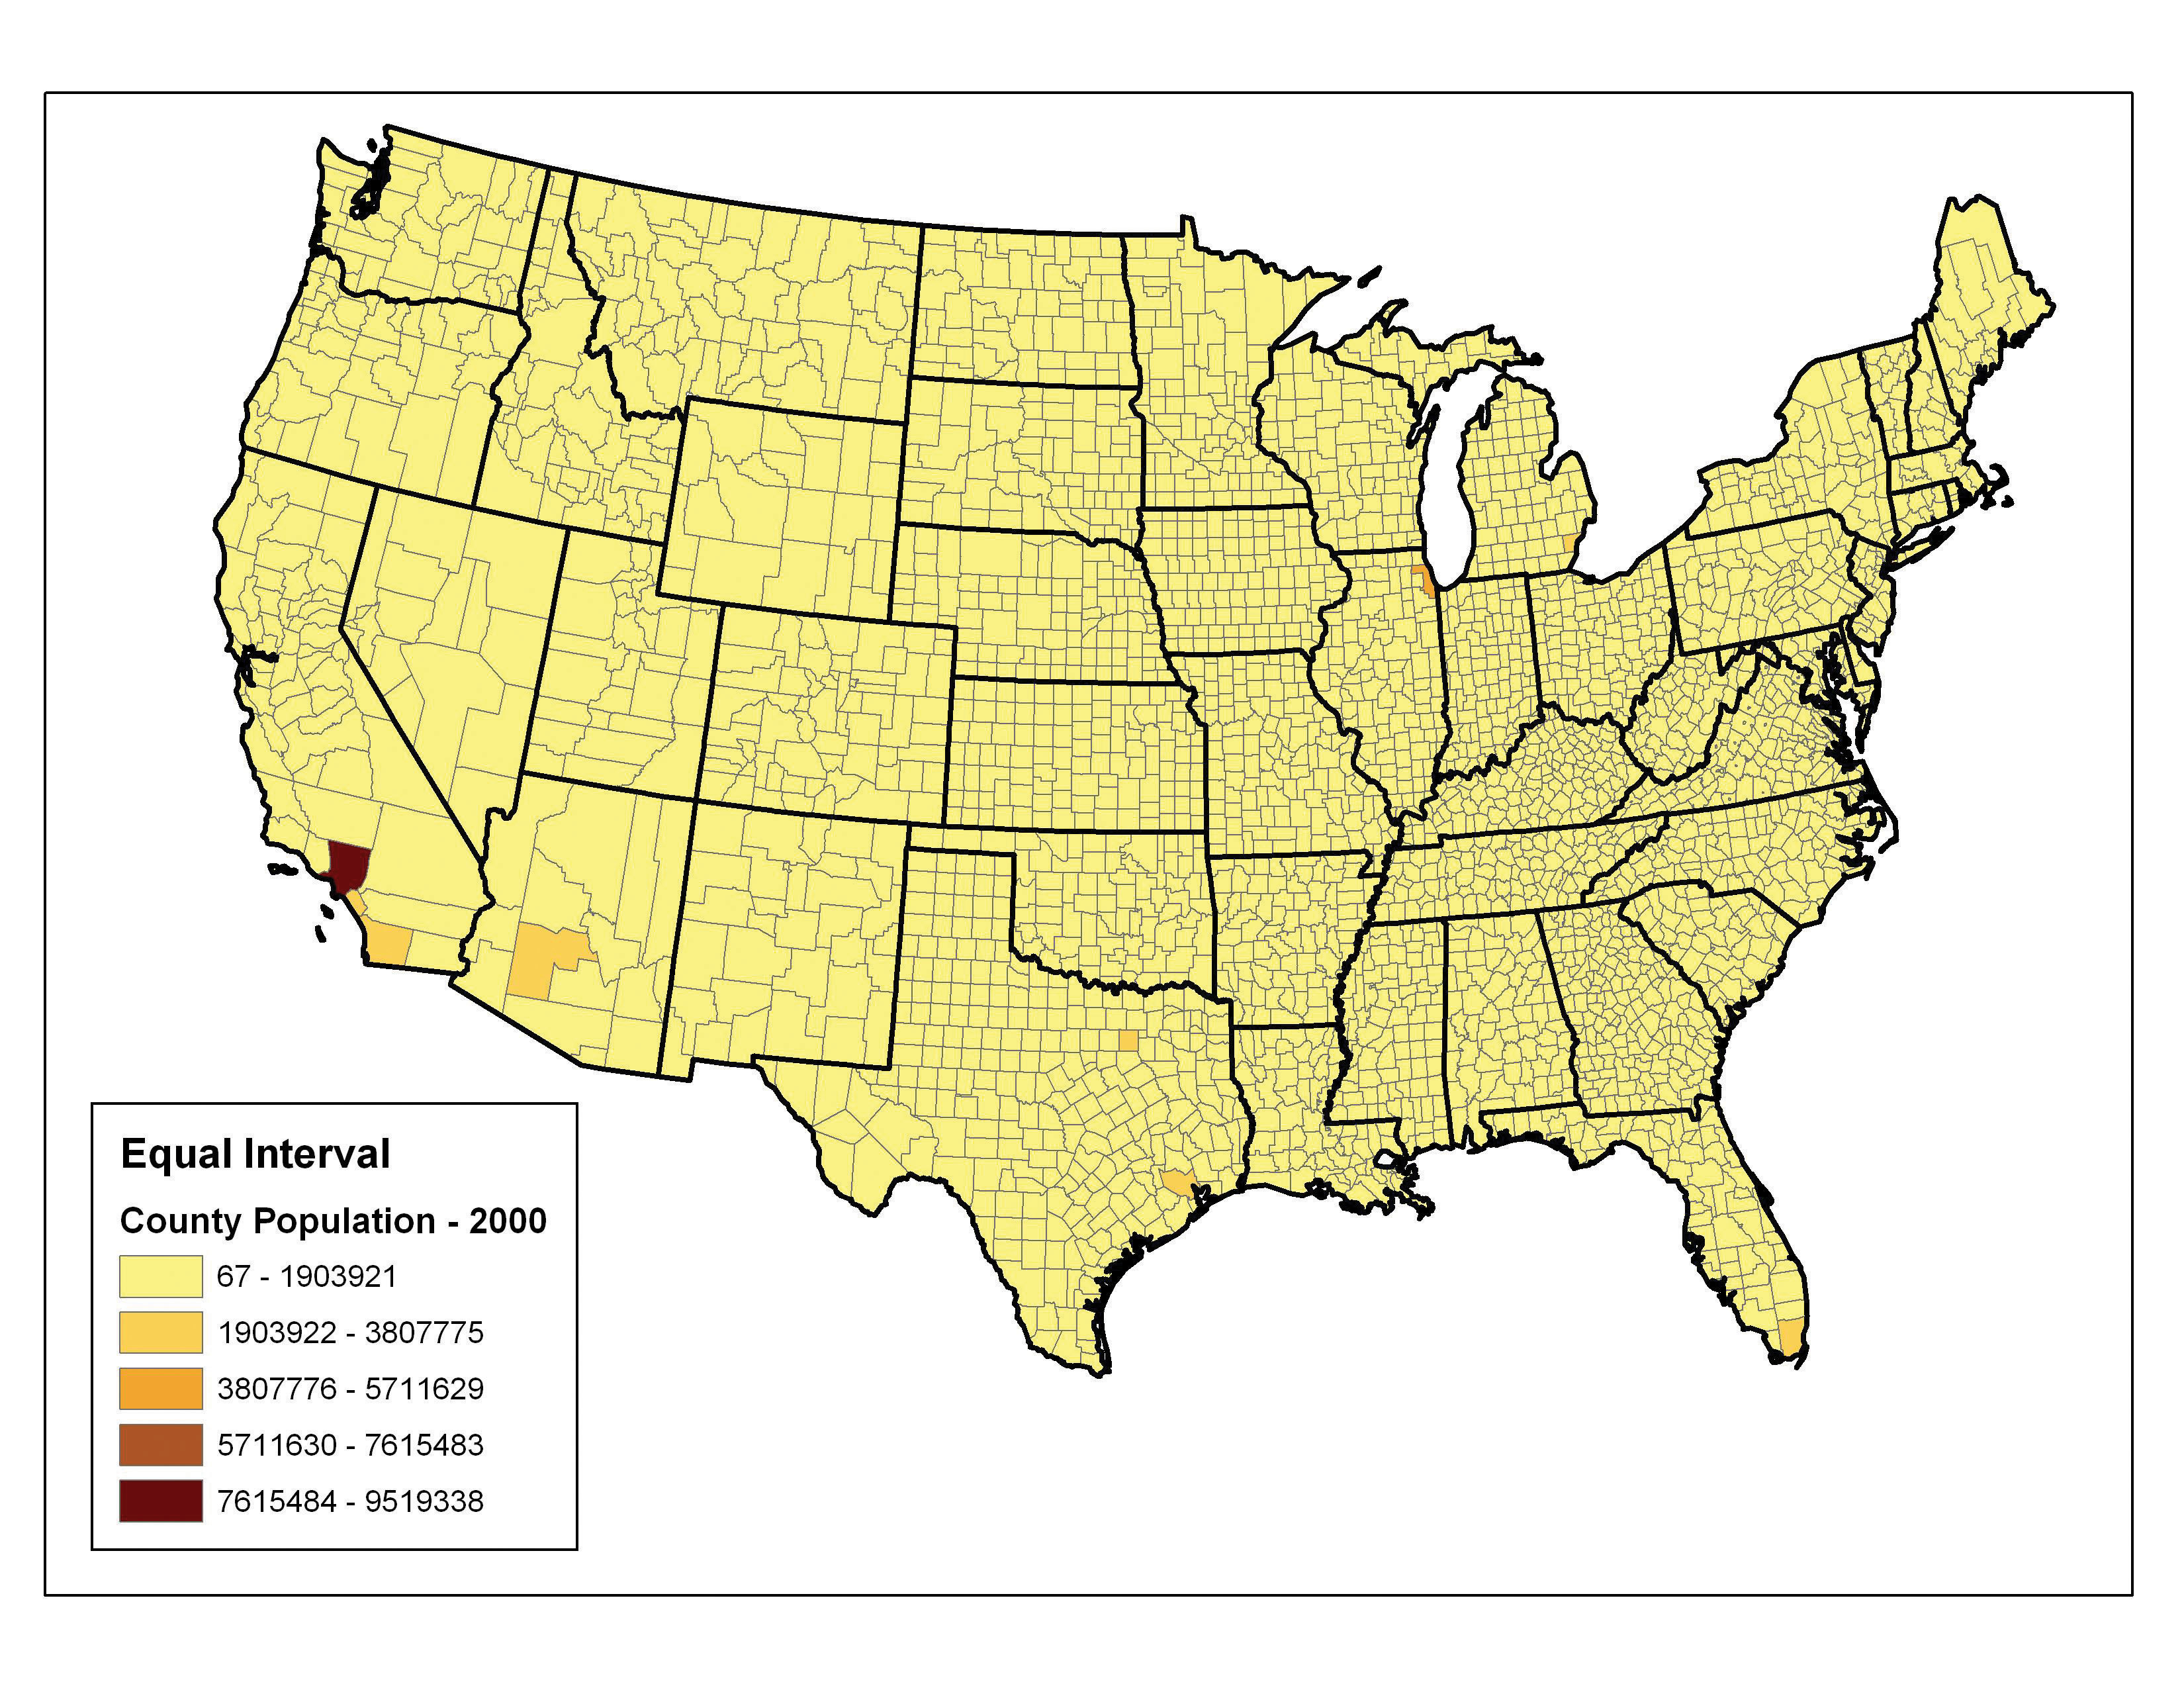
The effect I'm after is shown here. Bold state borders with lighter county borders. Sorry, not enough reputation to embed images.
Basically this is same answer by Roco, but is using highcharter.
live: http://rpubs.com/jbkunst/is-it-possible-to-include-maplines-in-highcharter-maps
code:
Hope it helps.
Thanks for use the package!
If you want to change the width of the borders, you would normally do that with via
borderWidthproperty, like you already do for the county lines.Your state lines are of different type, they belong to the
maplinetype. For this type, the documentation specifies that you need to uselineWidthrather thanborderWidth. This is what you need to change:This is an example of how I changed your initial JSFiddle to make the state lines much thicker than the county lines: JSFiddle here