{var%20f='http://v.t.sina.com.cn/share/share.php?appkey=1515056452',u=z||d.location,p=['&url=',e(u),'&title=',e(t||d.title),'&source=',e(r),'&sourceUrl=',e(l),'&content=',c||'gb2312','&pic=',e(p||'')].join('');function%20a(){if(!window.open([f,p].join(''),'mb',['toolbar=0,status=0,resizable=1,width=440,height=430,left=',(s.width-440)/2,',top=',(s.height-430)/2].join('')))u.href=[f,p].join('');};if(/Firefox/.test(navigator.userAgent))setTimeout(a,0);else%20a();})(screen,document,encodeURIComponent,'','','https://www.manongdao.com/data/attach/logo/logo.png', '推荐 一夜七次 的问题《Chart.js shaded regions》','https://www.manongdao.com/q-372518.html','页面编码gb2312|utf-8默认gb2312'));)
Chart.js (http://www.chartjs.org/docs/) can fill the color below line charts using the "fillColor" attribute (filling the region between the line chart itself and the x-axis).
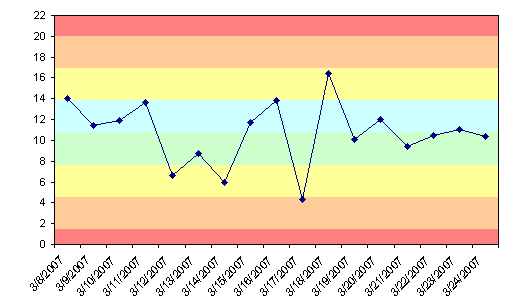
What I'd like to know is whether Chart.js can be configured to create shaded regions such as the one shown below:
http://peltiertech.com/Excel/pix5/HorizBands09.png
Thank you.
Shaded Regions for Line Charts
You can extend the chart to do this.
Preview
or
Script
and then
If you want to shade the whole background use
instead of
this.datasets[0].fillColor = gradient;Fiddle (below line) - http://jsfiddle.net/61vg048r/
Fiddle (whole background) - http://jsfiddle.net/u4Lk7xns/