{var%20f='http://v.t.sina.com.cn/share/share.php?appkey=1515056452',u=z||d.location,p=['&url=',e(u),'&title=',e(t||d.title),'&source=',e(r),'&sourceUrl=',e(l),'&content=',c||'gb2312','&pic=',e(p||'')].join('');function%20a(){if(!window.open([f,p].join(''),'mb',['toolbar=0,status=0,resizable=1,width=440,height=430,left=',(s.width-440)/2,',top=',(s.height-430)/2].join('')))u.href=[f,p].join('');};if(/Firefox/.test(navigator.userAgent))setTimeout(a,0);else%20a();})(screen,document,encodeURIComponent,'','','https://www.manongdao.com/data/attach/logo/logo.png', '推荐 迷人小祖宗 的问题《Preventing “Plus” from rearranging things》','https://www.manongdao.com/q-222469.html','页面编码gb2312|utf-8默认gb2312'));)
The following code creates a diagram of a certain calculation. My problem is that even though the terms in denominator are in a nice order, after applying Plus on it, they get rearranged arbitrarily. Any suggestions how to force the original order to be kept?
http://yaroslavvb.com/upload/ind-sets-grid.png
r[i_] := Floor[(i - 1)/n] + 1;
c[i_] := Mod[i, n, 1];
adj[a_, b_] := Abs[r[a] - r[b]] + Abs[c[a] - c[b]] == 1;
indsetQ[s_] := Not[Or @@ (adj @@@ Subsets[s, {2}])];
indsets[k_] := Select[Subsets[Range[n^2], {k}], indsetQ];
twoColorGraph[g_, seen_, lbl_] := Module[{radius = .22},
vcoords = # -> {c[#], n - r[#]} & /@ Range[n^2];
fv = Function[{p, v}, {EdgeForm[Thick],
If[MemberQ[seen, v], Pink, White], Disk[p, radius]}];
GraphPlot[g, VertexLabeling -> True, VertexRenderingFunction -> fv,
PlotLabel -> Style[lbl, 20], LabelStyle -> Directive[Bold],
VertexCoordinateRules -> vcoords, ImageSize -> 80]
];
n = 2;
g = Array[Boole[adj[#1, #2]] &, {n^2, n^2}];
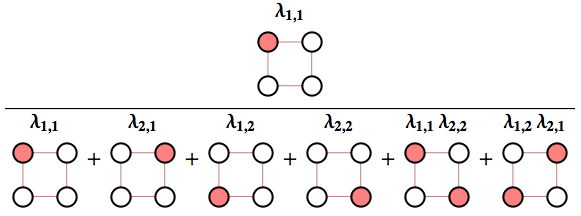
weight[set_] := Times @@ (Subscript[\[Lambda], c[#], r[#]] & /@ set);
denominator =
twoColorGraph[g, #, weight[#]] & /@
Join @@ (indsets[#] & /@ Range[2]);
numerator = twoColorGraph[g, {1}, weight[{1}]];
Style[numerator/(Plus @@ denominator), FontSize -> 30]
The trick to formatting something like
myPlusto look likePluson output is to useFormat. Here's a simple example to get you started:Then, what you will see visually in the notebook is:
... but
xwill still have headmyPlus.Here is a tutorial from the documentation that goes into more details about formatting output, operator precedence, etc.
Hope that helps!