In a recent project, I want to debug my program in production use state. The production environment is very complicated so I want to debug the program whenever I find a problem.
This is what I want to achieve: whenever I want to debug, I will send a kill signal to the program and hopefully pdb debugger will appear. It is something like this:
import pdb
import signal
import time

def handler(signal, frame):
  pdb.set_trace()

signal.signal(signal.SIGTERM, handler)
a=1
while True:
  a+=1
  time.sleep(1)
However, since I have to run the program with nohup, all output will be redirected to nohup.out, so there's no way I can interact with pdb.
Is there anything similar to do this?
If you run the program from a terminal you can use the tty command to note the
tty device you are on, and pass it to the program in the environment:
TTY=`tty` nohup ./myprog.py
and then in the handler open the tty again and set stdin and stdout to the file:
import sys,os

def handler(signal, frame):
  tty = os.getenv('TTY')
  sys.stdin = sys.stdout = open(tty,"r+")
  pdb.set_trace()
If you are detaching the program from the current tty as in your comment, then you
can try something similar, with the same python code. This time run your program with:
TTY=/tmp/link nohup ./myprog.py &
and close the terminal. Open a new terminal and create the missing link to this new tty:
ln -s `tty` /tmp/link
Then give, in one single line, the kill command to signal the python process, and
then immediately do a sleep. This is so that the shell is no longer competing with
pdb for input from the tty. Eg, on one line:
kill -term $pid; sleep 99999
You will then have pdb connect to /tmp/link, which is your tty. When you quit pdb, typing ctrl-c
will stop the sleep.
If you need to use ctrl-c in pdb, and you are using bash,
replace the sleep 99999 by suspend. When you quit pdb, use your terminal's menus to send signal sigcont
to the process to get back the suspended bash.
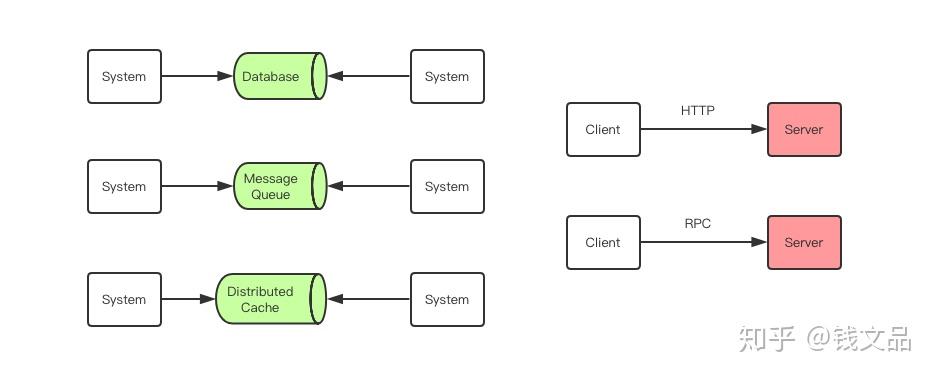
An entirely different approach, which is simpler and more elegant in my opinion, is to use rpyc. I've been using this approach for a long time now in my complex system, and it made real-time debugging vastly easier.
Basically, what you need to do is to define a simple rpyc API Service, which contains "exposed" methods to return references ("netrefs") to the most interesting objects in you system. Then, you start an rpyc ThreadedServer in your process, at startup time.
Then whenever you'd like, you can simply create an rpyc client, and connect to the process, retrieve references to the objects via the API, and inspect them (transparently, as if those netrefs are local objects). Using the right API methods, you can pretty much access anything you want in the live process.
Other advantages to this apprach are that (1) this interactive session doesn't even have to affect the running process (unless, of course, you invoke methods which cause side effects, etc.), (2) it doesn't have to be interactive, i.e. you can easily write a script which connects to the process and prints some info from it.


