I'm looking for a solution using json in order to retreive values out of my database and display them in seperate line charts. Not only the values are dynamic, but the titles are different for all charts as well.
This is my approach:
JSON
[{"name":"time","data":["14:01:37","14:01:40"]},{"name":"bmp085_pressure","data":[973.65,973.64]},{"name":"bmp085_sealvlPressure","data":[0,0]},{"name":"bmp085_altitude","data":[356.2512817383,356.8531799316]},{"name":"gps_altitude","data":[353.6,353.6]},{"name":"bmp085_tempC","data":[25.2,25.2]},{"name":"minimu9v2_tempCM","data":[73.4,73.4]},{"name":"raspi_tempC","data":[48.69,48.15]},{"name":"bmp085_tempF","data":[77.54,77.54]},{"name":"minimu9v2_tempFM","data":[23,23]},{"name":"raspi_tempF","data":[118.68,119.65]},{"name":"gps_speed","data":[0.021,0.026]},{"name":"hih6130_humidity","data":[53.6824989319,53.7496414185]},{"name":"minimu9v2_magGaussX","data":[0.42,0.415455]},{"name":"minimu9v2_magGaussY","data":[-0.109091,-0.112727]},{"name":"minimu9v2_magGaussZ","data":[0.42,0.415455]},{"name":"minimu9v2_accGX","data":[-0.145,-0.145]},{"name":"minimu9v2_accGY","data":[0.192,0.19]},{"name":"minimu9v2_accGZ","data":[0.952,0.951]},{"name":"minimu9v2_gyroDPSX","data":[-0.175,-0.175]},{"name":"minimu9v2_gyroDPSY","data":[-0.0875,-0.0875]},{"name":"minimu9v2_gyroDPSZ","data":[0.035,0.035]}]
index.php
<!DOCTYPE HTML>
<html>
<head>
    <meta http-equiv="Content-Type" content="text/html; charset=utf-8">
    <title>Hab-GPS Flightcharts</title>

    <script type="text/javascript" src="http://ajax.googleapis.com/ajax/libs/jquery/1.7.1/jquery.min.js"></script>
    <script type="text/javascript">
    $(document).ready(function() {
        var options = {
            chart: {
                type: 'line',
                marginRight: 130,
                marginBottom: 25
            },
            title: {
                x: -20 //center
            },
            subtitle: {
                text: '',
                x: -20
            },
            xAxis: {
                categories: []
            },
            yAxis: {
                title: {
                },
                plotLines: [{
                    value: 0,
                    width: 1,
                    color: '#808080'
                }]
            },
            tooltip: {
                formatter: function() {
                    return '<b>'+ this.series.name +'</b><br/>'+
                    this.x +': '+ this.y;
                }
            },
            legend: {
                layout: 'vertical',
                align: 'right',
                verticalAlign: 'top',
                x: -10,
                y: 100,
                borderWidth: 0
            },
            series: []
        }

        $.getJSON("data.php", function(json) {
            options.chart.renderTo = 'pressure';
            options.title.text = 'Pressure (hPa)';
            options.yAxis.title.text = 'Pressure (hPa)';
            options.xAxis.categories = json[0]['data'];
            options.series[0].data = json[1];
            options.series[1].data = json[2];
            chart1 = new Highcharts.Chart(options);
        });

        alert chart1;

        $.getJSON("data.php", function(json) {
            options.chart.renderTo = 'altitude';
            options.title.text = 'Altitude (m)';
            options.yAxis.title.text = 'Altitude (m)';
            options.xAxis.categories = json[0]['data'];
            options.series[2].data = json[3];
            options.series[3].data = json[4];
            chart2 = new Highcharts.Chart(options);
        });

        $.getJSON("data.php", function(json) {
            options.chart.renderTo = 'temperatureC';
            options.title.text = 'Temperature (C)';
            options.yAxis.title.text = 'Temperature (C)';
            options.xAxis.categories = json[0]['data'];
            options.series[5] = json[6];
            options.series[6] = json[7];
            options.series[7] = json[8];
            chart3 = new Highcharts.Chart(options);
        });

        $.getJSON("data.php", function(json) {
            options.chart.renderTo = 'temperatureF';
            options.title.text = 'Temperature (F)';
            options.yAxis.title.text = 'Temperature (F)';
            options.xAxis.categories = json[0]['data'];
            options.series[8] = json[9];
            options.series[9] = json[10];
            options.series[10] = json[11];
            chart4 = new Highcharts.Chart(options);
        });

        $.getJSON("data.php", function(json) {
            options.chart.renderTo = 'speed';
            options.title.text = 'Speed (km/h)';
            options.yAxis.title.text = 'Speed (km/h)';
            options.xAxis.categories = json[0]['data'];
            options.series[11] = json[12];
            chart5 = new Highcharts.Chart(options);
        });

        $.getJSON("data.php", function(json) {
            options.chart.renderTo = 'humidity';
            options.title.text = 'Humidity (RH%)';
            options.yAxis.title.text = 'Humidity (RH%)';
            options.xAxis.categories = json[0]['data'];
            options.series[12] = json[13];
            chart6 = new Highcharts.Chart(options);
        });

        $.getJSON("data.php", function(json) {
            options.chart.renderTo = 'maggauss';
            options.title.text = 'Magnetic Field (Gauss)';
            options.yAxis.title.text = 'Magnetic Field (Gauss)';
            options.xAxis.categories = json[0]['data'];
            options.series[13] = json[14];
            options.series[14] = json[15];
            options.series[15] = json[16];
            chart7 = new Highcharts.Chart(options);
        });

        $.getJSON("data.php", function(json) {
            options.chart.renderTo = 'accg';
            options.title.text = 'Acceleration (G)';
            options.yAxis.title.text = 'Acceleration (G)';
            options.xAxis.categories = json[0]['data'];
            options.series[16] = json[17];
            options.series[17] = json[18];
            options.series[18] = json[19];
            chart8 = new Highcharts.Chart(options);
        });

        $.getJSON("data.php", function(json) {
            options.chart.renderTo = 'gyrodps';
            options.title.text = 'Orientation (DPS)';
            options.yAxis.title.text = 'Orientation (DPS)';
            options.xAxis.categories = json[0]['data'];
            options.series[19] = json[20];
            options.series[20] = json[21];
            options.series[21] = json[22];
            chart9 = new Highcharts.Chart(options);
        });
    });

    </script>
    <script src="http://code.highcharts.com/highcharts.js"></script>
    <script src="http://code.highcharts.com/modules/exporting.js"></script>
</head>
<body>
    <div id="pressure" style="min-width: 400px; height: 400px; margin: 0 auto"></div>
    <div id="spacer" style="height: 20px"></div>
    <div id="altitude" style="min-width: 400px; height: 400px; margin: 0 auto"></div>
    <div id="spacer" style="height: 20px"></div>
    <div id="temperatureC" style="min-width: 400px; height: 400px; margin: 0 auto"></div>
    <div id="spacer" style="height: 20px"></div>
    <div id="temperatureF" style="min-width: 400px; height: 400px; margin: 0 auto"></div>
    <div id="spacer" style="height: 20px"></div>
    <div id="speed" style="min-width: 400px; height: 400px; margin: 0 auto"></div>
    <div id="spacer" style="height: 20px"></div>
    <div id="humidity" style="min-width: 400px; height: 400px; margin: 0 auto"></div>
    <div id="spacer" style="height: 20px"></div>
    <div id="maggauss" style="min-width: 400px; height: 400px; margin: 0 auto"></div>
    <div id="spacer" style="height: 20px"></div>
    <div id="accg" style="min-width: 400px; height: 400px; margin: 0 auto"></div>
    <div id="spacer" style="height: 20px"></div>
    <div id="gyrodps" style="min-width: 400px; height: 400px; margin: 0 auto"></div>
</body>
</html>
data.php
<?php
include_once 'phpsqlajax_dbinfo.php';

$con = mysql_connect(HOST,USER,PASSWORD);

if (!$con) {
  die('Could not connect: ' . mysql_error());
}

mysql_select_db(DATABASE, $con);

$sth = mysql_query("SELECT time FROM hab_TELEMETRICS");
$rows = array();
$rows['name'] = 'time';
while($r = mysql_fetch_array($sth)) {
$rows['data'][] = $r['time'];
}

$sth = mysql_query("SELECT bmp085_pressure FROM hab_TELEMETRICS");
$rows1 = array();
$rows1['name'] = 'bmp085_pressure';
while($r = mysql_fetch_array($sth)) {
    $rows1['data'][] = $r['bmp085_pressure'];
}

$sth = mysql_query("SELECT bmp085_sealvlPressure FROM hab_TELEMETRICS");
$rows2 = array();
$rows2['name'] = 'bmp085_sealvlPressure';
while($rr = mysql_fetch_assoc($sth)) {
    $rows2['data'][] = $rr['bmp085_sealvlPressure'];
}

$sth = mysql_query("SELECT bmp085_altitude FROM hab_TELEMETRICS");
$rows3 = array();
$rows3['name'] = 'bmp085_altitude';
while($rr = mysql_fetch_assoc($sth)) {
    $rows3['data'][] = $rr['bmp085_altitude'];
}

$sth = mysql_query("SELECT gps_altitude FROM hab_TELEMETRICS");
$rows4 = array();
$rows4['name'] = 'gps_altitude';
while($rr = mysql_fetch_assoc($sth)) {
    $rows4['data'][] = $rr['gps_altitude'];
}

$sth = mysql_query("SELECT bmp085_tempC FROM hab_TELEMETRICS");
$rows5 = array();
$rows5['name'] = 'bmp085_tempC';
while($rr = mysql_fetch_assoc($sth)) {
    $rows5['data'][] = $rr['bmp085_tempC'];
}

$sth = mysql_query("SELECT minimu9v2_tempCM FROM hab_TELEMETRICS");
$rows6 = array();
$rows6['name'] = 'minimu9v2_tempCM';
while($rr = mysql_fetch_assoc($sth)) {
    $rows6['data'][] = $rr['minimu9v2_tempCM'];
}

$sth = mysql_query("SELECT raspi_tempC FROM hab_TELEMETRICS");
$rows7 = array();
$rows7['name'] = 'raspi_tempC';
while($rr = mysql_fetch_assoc($sth)) {
    $rows7['data'][] = $rr['raspi_tempC'];
}

$sth = mysql_query("SELECT bmp085_tempF FROM hab_TELEMETRICS");
$rows8 = array();
$rows8['name'] = 'bmp085_tempF';
while($rr = mysql_fetch_assoc($sth)) {
    $rows8['data'][] = $rr['bmp085_tempF'];
}

$sth = mysql_query("SELECT minimu9v2_tempFM FROM hab_TELEMETRICS");
$rows9 = array();
$rows9['name'] = 'minimu9v2_tempFM';
while($rr = mysql_fetch_assoc($sth)) {
    $rows9['data'][] = $rr['minimu9v2_tempFM'];
}

$sth = mysql_query("SELECT raspi_tempF FROM hab_TELEMETRICS");
$rows10 = array();
$rows10['name'] = 'raspi_tempF';
while($rr = mysql_fetch_assoc($sth)) {
    $rows10['data'][] = $rr['raspi_tempF'];
}

$sth = mysql_query("SELECT gps_speed FROM hab_TELEMETRICS");
$rows11 = array();
$rows11['name'] = 'gps_speed';
while($rr = mysql_fetch_assoc($sth)) {
    $rows11['data'][] = $rr['gps_speed'];
}

$sth = mysql_query("SELECT hih6130_humidity FROM hab_TELEMETRICS");
$rows12 = array();
$rows12['name'] = 'hih6130_humidity';
while($rr = mysql_fetch_assoc($sth)) {
    $rows12['data'][] = $rr['hih6130_humidity'];
}

$sth = mysql_query("SELECT minimu9v2_magGaussX FROM hab_TELEMETRICS");
$rows13 = array();
$rows13['name'] = 'minimu9v2_magGaussX';
while($rr = mysql_fetch_assoc($sth)) {
    $rows13['data'][] = $rr['minimu9v2_magGaussX'];
}

$sth = mysql_query("SELECT minimu9v2_magGaussY FROM hab_TELEMETRICS");
$rows14 = array();
$rows14['name'] = 'minimu9v2_magGaussY';
while($rr = mysql_fetch_assoc($sth)) {
    $rows14['data'][] = $rr['minimu9v2_magGaussY'];
}

$sth = mysql_query("SELECT minimu9v2_magGaussZ FROM hab_TELEMETRICS");
$rows15 = array();
$rows15['name'] = 'minimu9v2_magGaussZ';
while($rr = mysql_fetch_assoc($sth)) {
    $rows15['data'][] = $rr['minimu9v2_magGaussZ'];
}

$sth = mysql_query("SELECT minimu9v2_accGX FROM hab_TELEMETRICS");
$rows16 = array();
$rows16['name'] = 'minimu9v2_accGX';
while($rr = mysql_fetch_assoc($sth)) {
    $rows16['data'][] = $rr['minimu9v2_accGX'];
}

$sth = mysql_query("SELECT minimu9v2_accGY FROM hab_TELEMETRICS");
$rows17 = array();
$rows17['name'] = 'minimu9v2_accGY';
while($rr = mysql_fetch_assoc($sth)) {
    $rows17['data'][] = $rr['minimu9v2_accGY'];
}

$sth = mysql_query("SELECT minimu9v2_accGZ FROM hab_TELEMETRICS");
$rows18 = array();
$rows18['name'] = 'minimu9v2_accGZ';
while($rr = mysql_fetch_assoc($sth)) {
    $rows18['data'][] = $rr['minimu9v2_accGZ'];
}

$sth = mysql_query("SELECT minimu9v2_gyroDPSX FROM hab_TELEMETRICS");
$rows19 = array();
$rows19['name'] = 'minimu9v2_gyroDPSX';
while($rr = mysql_fetch_assoc($sth)) {
    $rows19['data'][] = $rr['minimu9v2_gyroDPSX'];
}

$sth = mysql_query("SELECT minimu9v2_gyroDPSY FROM hab_TELEMETRICS");
$rows20 = array();
$rows20['name'] = 'minimu9v2_gyroDPSY';
while($rr = mysql_fetch_assoc($sth)) {
    $rows20['data'][] = $rr['minimu9v2_gyroDPSY'];
}

$sth = mysql_query("SELECT minimu9v2_gyroDPSZ FROM hab_TELEMETRICS");
$rows21 = array();
$rows21['name'] = 'minimu9v2_gyroDPSZ';
while($rr = mysql_fetch_assoc($sth)) {
    $rows21['data'][] = $rr['minimu9v2_gyroDPSZ'];
}

$result = array();
array_push($result,$rows);
array_push($result,$rows1);
array_push($result,$rows2);
array_push($result,$rows3);
array_push($result,$rows4);
array_push($result,$rows5);
array_push($result,$rows6);
array_push($result,$rows7);
array_push($result,$rows8);
array_push($result,$rows9);
array_push($result,$rows10);
array_push($result,$rows11);
array_push($result,$rows12);
array_push($result,$rows13);
array_push($result,$rows14);
array_push($result,$rows15);
array_push($result,$rows16);
array_push($result,$rows17);
array_push($result,$rows18);
array_push($result,$rows19);
array_push($result,$rows20);
array_push($result,$rows21);

print json_encode($result, JSON_NUMERIC_CHECK);

mysql_close($con);
?>
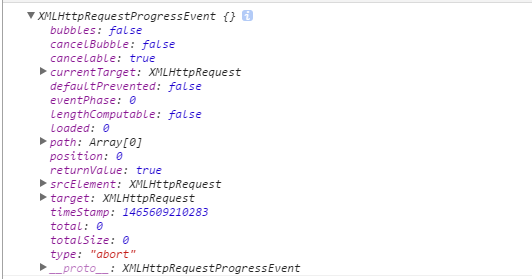
Currently I get the following errors:
index.php
TypeError: options.series[0] is undefined
TypeError: options.series[2] is undefined
highcharts.js
TypeError: d[e] is undefined


